ATNA Plugin
EHRbase provides capabilities to log all accesses to its services based on the ATNA (Audit Trail and Node Authentication) specification.
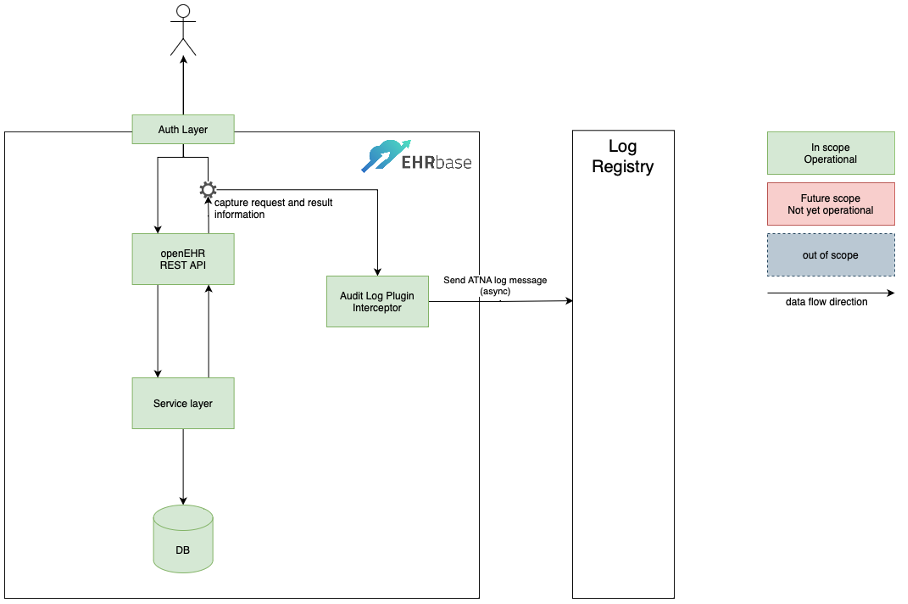
The ATNA logging functionality is implemented using the EHRbase Plugin mechanism. The following services are covered by the ATNA Logging Plugin:
- Definition
- Stored query
List stored queries
Store a query
Get stored query and info/metadata
Delete stored query
- EHR
- EHR
Create EHR
Create EHR with ID
Get EHR summary by ID
Get EHR summary by Subject ID
- EHR Status
Get EHR Status version by time
Get EHR Status by version ID
Update EHR Status
- Versioned EHR Status
Get Versioned EHR Status
Get Versioned EHR Status revision history
Get Versioned EHR Status version by time
Get Versioned EHR Status version by ID
- Composition
Create Composition
Update Composition
Delete Composition
Get Composition by version ID
Get Composition at time
Delete Composition
- Versioned Composition
Get Versioned Composition
Get Versioned Composition revision history
Get Versioned Composition version by ID
Get Versioned Composition version at time
- Directory
Create Directory
Update Directory
Delete Directory
Get Folder in Directory version
Get Folder in Directory version at time
- Contribution
Create Contribution
Get Contribution by ID
- Query
Execute ad-hoc (non-stored) AQL Query
Execute Store Query
- Admin
- EHR
Update EHR
Delete EHR
- Composition
Delete Composition
- Directory
Delete Directory
- Contribution
Delete Contribution
Parameters / Environment Variables
Parameter |
Env Variable |
Use |
Example |
|---|---|---|---|
ipf.atna.audit-enabled |
IPF_ATNA_AUDITENABLED |
Whether to enable ATNA audit feature |
“true” |
ipf.atna.audit-enterprise-site-id |
IPF_ATNA_AUDITENTERPRISESITEID |
Enterprise Site ID (CDR Base Tenant ID is used) |
1f332a66-0e57-11ed-861d-0242ac120002 |
ipf.atna.audit-repository-host |
IPF_ATNA_AUDITREPOSITORYHOST |
Audit repository host |
localhost |
ipf.atna.audit-repository-port |
IPF_ATNA_AUDITREPOSITORYPORT |
Audit repository port |
514 |
ipf.atna.audit-source-id |
IPF_ATNA_AUDITSOURCEID |
Audit source ID |
${spring.application.name} |
ipf.atna.audit-value-if-missing |
IPF_ATNA_AUDITVALUEIFMISSING |
Value used for mandatory elements that are empty. |
UNKNOWN |
ATNA Message Example and Mapping
The code listing shows an example ATNA message that is created whenever a user creates an electronic health record object (EHR) in EHRbase. The user information is either extracted from the Basic Auth credentials or from the OAuth2 JWT Token.
<!-- EHR creation successful -->
<?xml version="1.0" encoding="UTF-8"?>
<AuditMessage>
    <EventIdentification EventActionCode="C" EventDateTime="2023-09-21T10:13:50.289269153Z" EventOutcomeIndicator="0">
        <EventID csd-code="110110" codeSystemName="DCM" originalText="Patient Record" />
        <EventOutcomeDescription>Operation performed successfully</EventOutcomeDescription>
    </EventIdentification>
    <ActiveParticipant UserID="john doe " UserIsRequestor="true" NetworkAccessPointID="10.216.24.150"
        NetworkAccessPointTypeCode="2">
        <RoleIDCode csd-code="110153" codeSystemName="DCM" originalText="Source Role ID" />
    </ActiveParticipant>
    <ActiveParticipant UserID="ehrbase" UserIsRequestor="false" NetworkAccessPointID="10.42.23.77"
        NetworkAccessPointTypeCode="2">
        <RoleIDCode csd-code="110152" codeSystemName="DCM" originalText="Destination Role ID" />
    </ActiveParticipant>
    <AuditSourceIdentification AuditEnterpriseSiteID="1f332a66-0e57-11ed-861d-0242ac120002" AuditSourceID="ehrbase">
        <AuditSourceTypeCode csd-code="4" codeSystemName="DCM" originalText="Application Server Process or Thread" />
    </AuditSourceIdentification>
    <ParticipantObjectIdentification ParticipantObjectID="ae1d91f9-43c4-4ed9-bea0-51e2f1494e0b"
        ParticipantObjectTypeCode="1" ParticipantObjectTypeCodeRole="1" ParticipantObjectDataLifeCycle="1">
        <ParticipantObjectIDTypeCode csd-code="2" codeSystemName="RFC-3881" originalText="Patient Number" />
    </ParticipantObjectIdentification>
</AuditMessage>
Field |
Explanation |
Mapping |
|---|---|---|
EventActionCode |
Represents the action performed |
“Create(“”C””), Read(“”R””), Update(“”U””), Delete(“”D””), Execute(“”E””)” |
EventDateTime |
The Data of the Message |
Use current datetime |
EventOutcomeIndicator |
status of the operation |
“Success(0), MinorFailure(4), SeriousFailure(8), MajorFailure(12)” |
EventID.csd-code and EventID.originalText |
type of the entity |
“a) In case of an EHR: csd-code=””110110”” and originalText=””Patient Record””; b) for the rest: always the string composition, contribution, query, or directory” |
AuditEnterpriseSiteID |
ID of the audit producing system |
Tenant-ID of EHRbase |
ActiveParticipant.UserID |
The user identifier |
“a) Basic Auth: username; b) OAuth2: sub claim from the token” |
ParticipantObjectID [EHR] |
The EHR was affected by the transaction |
EHR and EHR Status: 1 x ParticipantObjectIdentification with ParticipantObjectTypeCode=1, ParticipantObjectIDTypeCode.originalText=URI, and ParticipantObjectID as the Patient Subject ID of the HER |
ParticipantObjectID [Composition, Contribution, Directory] |
Compositions, Contributions, or the Directory was affected by the transaction |
“a) ParticipantObjectTypeCode=1, ParticipantObjectIDTypeCode.originalText=Patient Number, and ParticipantObjectID is the Patient Subject ID of the parent EHR; b) ParticipantObjectTypeCode=2, ParticipantObjectIDTypeCode.originalText=URI, and ParticipantObjectID in the form /ehr/{ehrId}/{object}/{?objectId}” |
ParticipantObjectID [Ad-hoc query execution] |
Ad-hoc queries are part of the transaction |
Ad-hoc query execution: 1 x ParticipantObjectIdentification with ParticipantObjectTypeCode=2, ParticipantObjectIDTypeCode.originalText=Search Criteria, and ParticipantObjectID set to UNKNOWN |
ParticipantObjectID [Stored queries] |
Creation and execution of stored queries are part of the transaction |
“a) ParticipantObjectTypeCode=2, ParticipantObjectIDTypeCode.originalText=URI, and ParticipantObjectID in the form /definition/query/{queryQualifiedName}/{?version}; b) ParticipantObjectTypeCode=2, ParticipantObjectIDTypeCode.originalText=Search Criteria, and ParticipantObjectID as the qualified name of the query” |
NetworkAccessPointID |
Identification of the user device that creates the audit record |
The IP address of the requesting client |
Setup an Audit Repository
The easiest way to install and configure your own Audit Record Repository instance is to used the Elastic Stack together with Docker.
Step 1: Create the Docker Compose file
The following Docker Compose file installs and configures Elasticsearch, Kibana and Logstash according to the default configuration used in CDR Base.
services:
  elasticsearch:
    image: elasticsearch:7.7.0
    hostname: elasticsearch
    environment:
      - "discovery.type=single-node"
    ports:
      - 9200:9200
      - 9300:9300
    networks:
      - elastic-network
  kibana:
    image: kibana:7.7.0
    hostname: kibana
    ports:
      - 5601:5601
    links:
      - elasticsearch:elasticsearch
    depends_on:
      - elasticsearch
    networks:
      - elastic-network
  logstash:
    image: logstash:7.7.0
    hostname: logstash
    ports:
      - 9600:9600
      - 8089:8089
      - 514:514/udp
    volumes:
      - ./logstash:/usr/share/logstash/pipeline/
    links:
      - elasticsearch:elasticsearch
    depends_on:
      - elasticsearch
    networks:
      - elastic-network
networks:
  elastic-network: { }
Step 2: Create the Docker Compose file
The second step is the configuration of Logstash to enable the support of the Syslog Protocol and DICOM Audit Trail Message Format Profile. The following configuration file has to be stored in the directory referenced in the volume mounted in the logstash service declared in the Docker Compose file above (i.e. ./logstash/logstash.conf).
input {
  udp {
    port => 514

  }
}
filter {
  grok {
    match => {
      "message" => "<%{NONNEGINT:syslog_header_pri}>%{NONNEGINT:syslog_header_version}%{SPACE}(?:-|%{TIMESTAMP_ISO8601})%{SPACE}(?:-|%{IPORHOST:syslog_header_hostname})%{SPACE}(?:%{SYSLOG5424PRINTASCII:syslog_header_app-name}|-)%{SPACE}(?:-|%{SYSLOG5424PRINTASCII:syslog_header_procid})%{SPACE}(?:-|%{SYSLOG5424PRINTASCII:syslog_header_msgid})%{SPACE}(?:-|(?<syslog_structured_data>(\[.*?[^\\]\])+))(?:%{SPACE}%{GREEDYDATA:syslog_message}|)"
    }
  }
  xml {
    store_xml => true
    target => "AuditMessage"
    force_array => false
    source => "syslog_message"
  }
  mutate {
    remove_field => [ "@timestamp", "@version", "message", "host" ]
  }
}
output {
  elasticsearch { hosts => ["elasticsearch:9200"] }
}
Step 3: Start your Audit Repository instance
docker-compose -f docker-compose-audit.yml up